Coprata

UX/UI & Service Design
Summary
Coprata is a wellness company developing smart toilets that allow users to monitor their gut health through automatic at-home stool analysis. Currently, Coprata is preparing for a pilot launch of their toilets. While they have a method for collecting data, they needed a way to present that data to users. Our team of UX designers utilized the double diamond process to create a web portal interface to deliver personalized data to users. We also provided a service design blueprint that clarified how the new web portal would be integrated into their product release.
Timeline
2.5 week Sprint, Jan - Feb 2022
My Role
Research Synthesis Lead, Design Systems Lead
Tools
Figma, Canva, Gsuite
Deliverables
Web Portal Prototype, Service Design Blueprint
Methods
Competitive & Comparative Analysis, User Surveys, User Interviews, Affinity Mapping, Persona Development, User Flows, Storyboarding, Sus Surveys & Usability Testing, Service Blueprint, Design Studio, Sketching, Wireframing, and Prototyping.
The current reality of gut-health wellness
Prior to smart toilet technology, understanding gut health has been a matter of seeking assistance from a doctor when something is noticeably wrong. This process is typically a prolonged and often times unpleasant experience.
Storyboard

Your stomach hasn't been feeling well for a while now

After collecting your sample, you quickly drop it off at the doctor's office hoping no one sees you

You call your doctor to get an explanation of your results

Your schedule a visit with your doctor to see what's wrong

You wait for days to get your results, all the while still feeling unwell

The doctor tells you it's nothing serious, it could just be IBS. They recommend you monitor your symptoms and avoid certain foods.

Your doctor recommends a stool sample to check for any serious issues

Finally, your results are available on your online chart, but what do they even mean?

The doctor tells you to check back in after a few months, now what? You need to improve your gut health but you don't know where to start. There has to be a better way...
Coprata is taking a new approach
Their groundbreaking technology enables discreet data collection via AI imaging and stool analysis conducted within the plumbing of the toilet. From there, an algorithm processes the results and calculates an easily understandable Coprata score, which offers insight into a user's overall health. This transforms the way in which we approach gut health, shifting from a treatment-focused to a preventive approach.
Understand Coprata’s Users & business model in order to design a system for gut health data delivery that is easy to understand.
The Challenge
The Solution
A high-fidelity web portal prototype that prioritizes users’ needs and Coprata’s business goals while achieving a system Usability score of 90.4 (excellent).
The Process
Our team utilized the double-diamond approach to research and develop our solution.

Discovering our user
User Surveys
Our initial goal was to gain a clearer understanding of the target audience for Coprata. Coprata’s available market research was limited however their product waitlist suggests that women over the age of 40 are the target audience. We wanted to further this research so we created a survey to obtain demographic information on anyone interested in smart toilet technology, or those who are interested in tracking their gut health.

5 out of 6 users had an existing gut health issues
5 out of 6 users track their gut health/bathroom habits

5 out of 6 users eat certain foods or take supplements to improve their
Findings:
-
Information on how individuals monitor their gut health and the steps they take to improve it is essential in understanding what users of Coprata need.
-
To reach Coprata’s target audience we must prioritize interviewing individuals who have existing gut health issues.
User Interviews
We used this survey data to inform how we would conduct 10 in-depth interviews. Our goal for interviewing was to find out what information and statistics are the most important for users. We also wanted to understand who’s interested in tracking their gut health, how they might be tracking it now, and why. After conducting our interviews, I led affinity mapping sessions to synthesize our research and decipher the most important takeaways.

60%
have ibs or another gut health issue
40%
no conditions

70%
women
30%
men

30%
Millenial
30%
Gen-X
40%
Gen-Z
Takeaways:
8/10 Users
do not feel comfortable interpreting health results on their own (had a doctor explain their results, or used google)
7/10 Users
only track their gut health mentally, don't use any physical or digital method
4/10 Users
want to know what their next steps are when something is wrong
Findings:
-
There is an opportunity to present health data in a more user-friendly and understandable format
-
Users could benefit from a tracking system that works seamlessly in their day-to-day lives to eliminate the stress of tracking it themselves.
-
Users want to see more than just their data, they want to know what to do with it.
Defining Coprata's primary user
Using our survey and interview research we created a user persona to define who we are designing for and allow us to keep their specific user needs and characteristics in mind. Meet Catherine,

Problem Statement
Catherine needs consistent and in-depth information on her gut health so that she can improve her overall health and better manage her IBS.
How might we...
-
alleviate Catherine’s mental stress of interpreting test results?
-
provide Catherine with a way to view test results in a timely manner?
-
deliver suggestions to help prevent future health issues?
-
effectively track Catherine’s entire dietary habits that could lead to certain gut health issues?
Catherine's experience with Coprata

Catherine's stomach isn't feeling well

She's concerned that her IBS is flaring up again, but getting tested by a doctor would take a lot of time and effort

Catherine decides to use her Coprata toilet to take a sample instead

She logs in to the Coprata site to see her score

She notices that her newest score is lower than normal because the consistency was off, and her constipation level is high

She sees that drinking more water and increasing fiber are common next steps for constipation relief

Catherine makes sure to reach her goal of 30g of fiber, and 2 liters of water a day

Catherine checks her Coprata score periodically throughout the week and sees improvement

Catherine is relieved that she was able to monitor her gut health and make improvements easily and without making a visit to the doctor.
Designing the solution
We started contemplating our solution by considering our primary users’ needs. To gain a better understanding of how Catherine’s customer journey would be incorporated into Coprata’s business model we developed a service blueprint.
A service blueprint gives a full picture of the service that a company offers its users by showing how people, props (physical and digital evidence), and processes interact with one another along the user’s journey. By creating a service blueprint, we were able to better understand the whole picture of the service that Coprata is looking to give users like Catherine while pinpointing some opportunities for growth that the company should consider as they prepare to put their toilet on the market.
*Blue stickers note areas of opportunity

Key Takeaways:
In order for Catherine to be able to successfully use Coprata, these backstage actions and support processes need to be considered
-
SEO to make Coprata’s website easier for users to find
-
Payment processing so users can purchase a toilet and schedule delivery
-
Toilet distribution/manufacturing to make, deliver, and install the toilets
-
Webpage interface so users can receive their collected data
Creating an interface
Because a webpage interface showed up twice within our service blueprint, we decided to design this interface for Coprata as their system for data delivery. Below are the wireframes we made early in the design process.
User Flow
After our initial wireframes, we created a user flow to plan out how our wireframes would be prototyped together
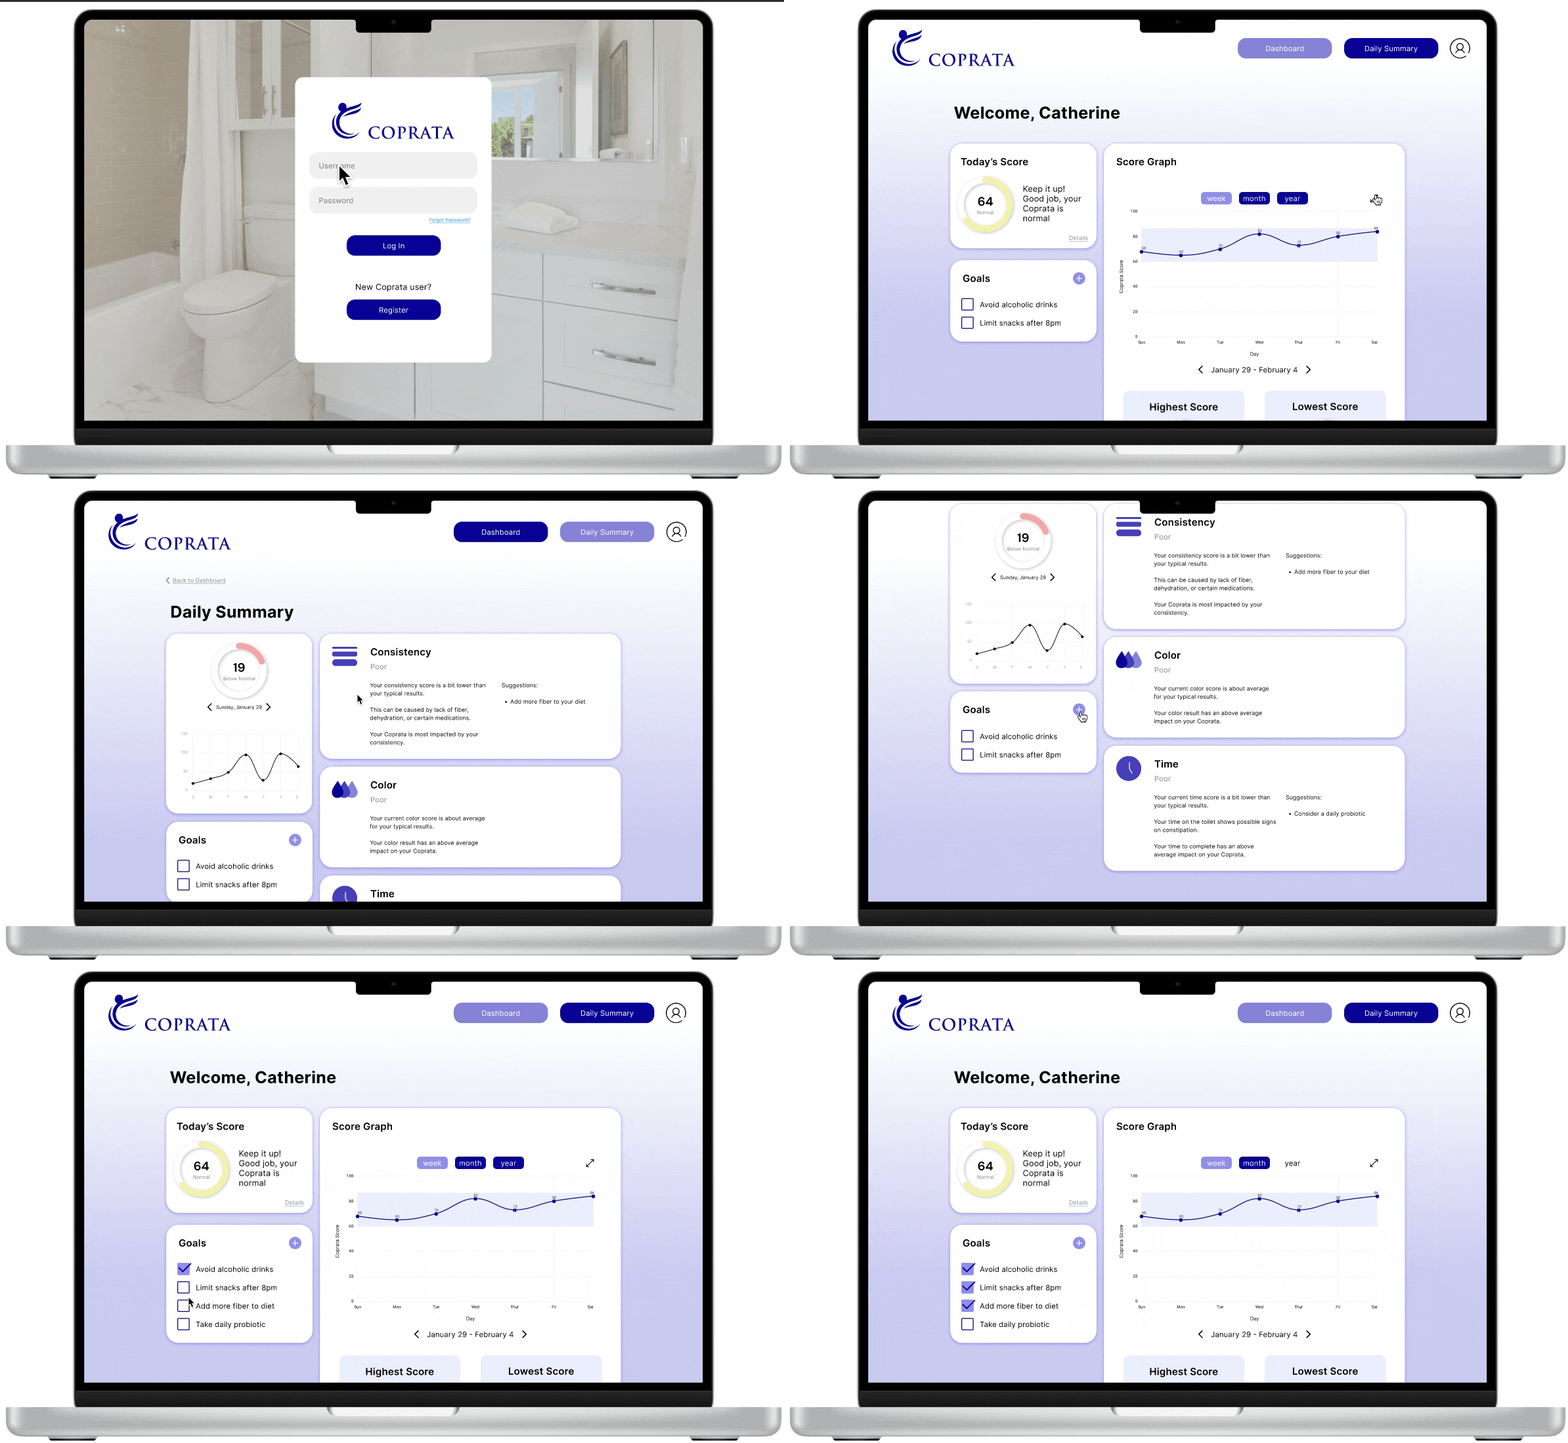
Catherine's user flow for logging in and viewing her lowest weekly score and adding goals to her dashboard

First-iteration Prototype
Following Catherine's user flow we created our first-iteration prototype

Usability testing
After creating our first-iteration prototype we wanted to confirm our design decisions and find possible problem areas with usability. With 8 participants we conducted usability testing and asked them to complete the following tasks and a system usability scale survey (SUS Survey).
Tasks:
-
Log-in, find your lowest coprata score of the week, and view the details
-
Read through the details on your low score, and use that information to add two new goals.
-
Return to the main page and expand the monthly graph to full screen
After completing the tasks users were asked to complete a system usability scale (SUS) survey to give a numerical value to the usability of the website.
Results
Average SUS Score: 84.4 (excellent)
6/8 Users
struggled interacting with the goals section of the dashboard
5/8 Users
expected to be able to interace with the graph
6/8 Users
had 2 or more errors working through the tasks
Feature Changes
The results from usability testing led us to make some design changes. Most notably 6 out of 8 users struggled with the goals section of the dashboard, so we revisited our research data to decide if the feature was necessary to include in our prototype.
When we went back to our interview notes, we noticed that users expressed they typically wouldn’t use a website like this to keep up-to-date goals that they wanted to achieve. However, they did express that tracking their food intake was important to them.
User Interview Data
7/10 Users
mentally track their eating habits & gut health
5/10 Users
have eliminated foods from their diet or avoid certain foods
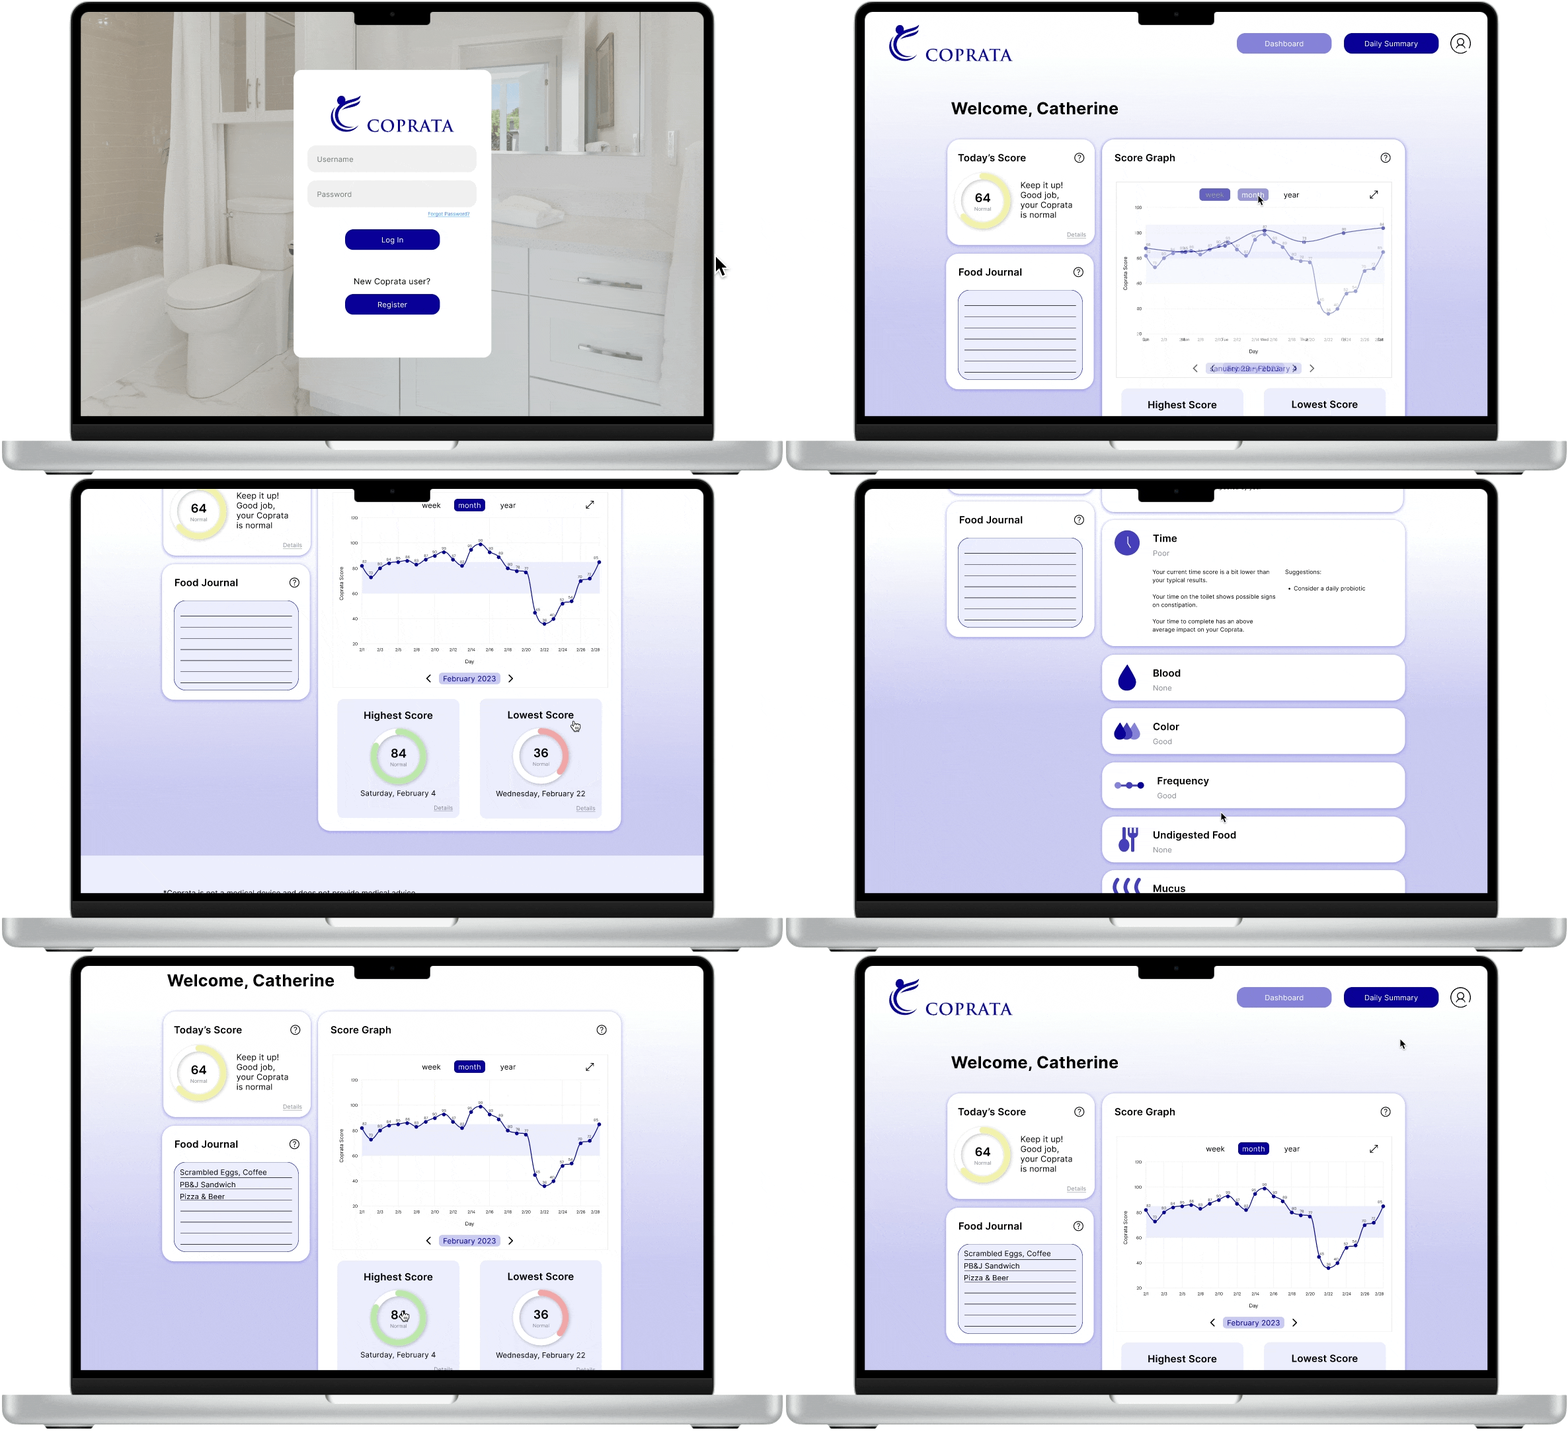
So we shifted our focus from a goals section towards a food log where users could keep a running list of food intake that they could use later to identify patterns or trends in how those foods affect their gut health. This allows for future partnerships with a dietician to provide users with individualized results.


Further prototype adjustments:
-
Changed the color of week, month, and year selector to create higher contrast between selected and deselected options
-
Added help buttons to include information on what scores mean and how to interact with the dashboard
-
Made graph points interactable
-
Increased the size of the expanded graph to fill the screen
Final Results
Average SUS Score: 90.4 (excellent)
5/6 Users
Were able to find their lowest score summary with 0 mistakes
6/6 Users
Were able to fill out their food journal with 0 mistakes
Decrease
in time to complete tasks from previous usability test
By testing and adjusting our design, we were able to increase the overall usability of our design, reduce errors, and decrease the time to complete tasks. This shows the success of our solution. Overall, we created a design that caters to our user's wants and needs and aligns with Coprata’s business goals and their desire to create a system that people want to use.
Next Steps
With the delivery of our web portal interface, we also recommended these next steps for Coprata.
-
Connect with a development team to build the responsive interface and connect to their current database
-
Finalize a data interpretation method to establish constraints that will transform numerical data into easy-to-understand metrics for users
-
Improve SEO for more organic search results and reach new potential customers.

